Monte Generoso

1600 masl

Published

January 23, 2025

Code
TARGET_SITE_ID = 4
Code
from datetime import datetime, timedelta, timezone

import matplotlib.pyplot as plt
import numpy as np
import pandas as pd
import seaborn as sns

from startleiter.utils import get_engine, get_flights

engine = get_engine()
df = get_flights(engine, TARGET_SITE_ID)

Annual statistics

Code
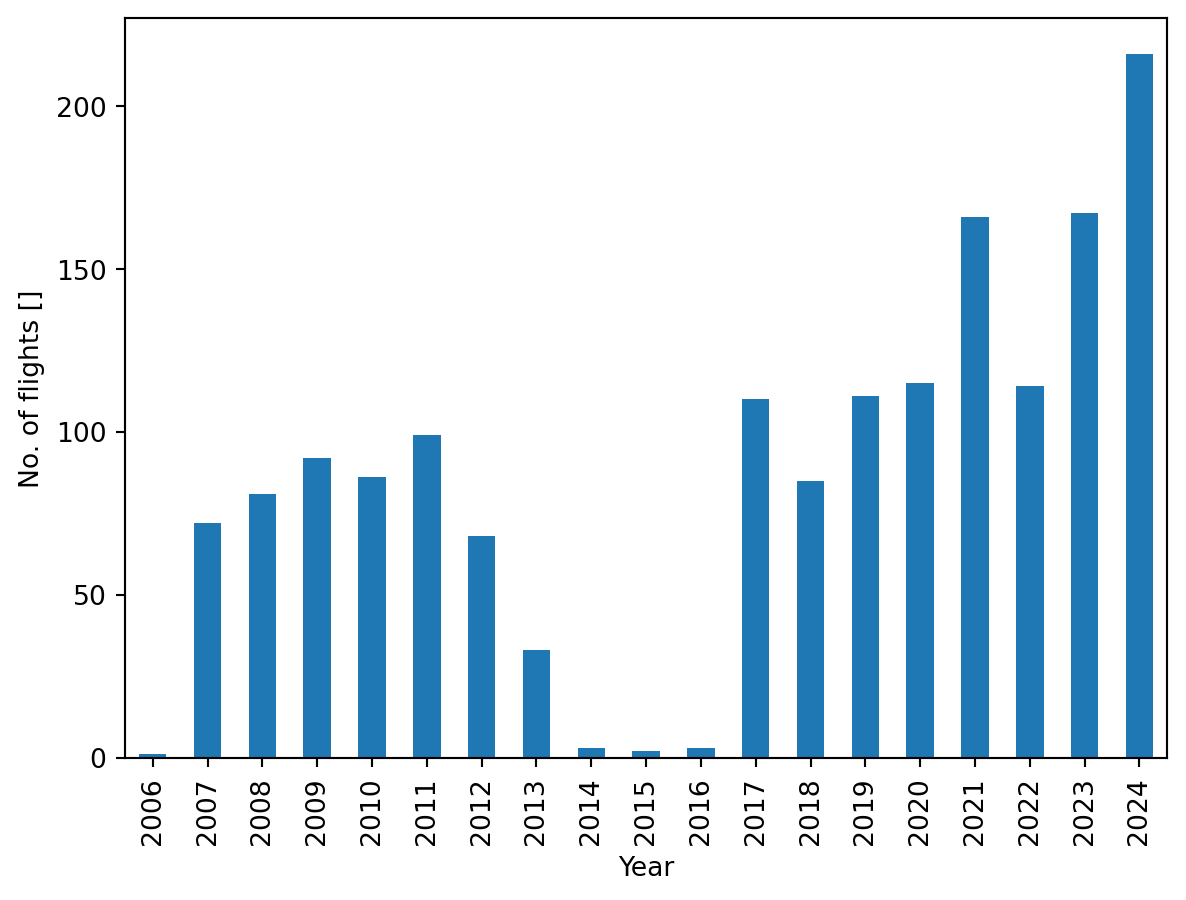
dfg = df.groupby(df.datetime.dt.year).datetime.count()
ax = dfg.plot(kind="bar", ylabel="No. of flights []", xlabel="Year")
Figure 1: Total number of flights per year
Code
dfg = df.groupby(df.datetime.dt.year).max_altitude_m
dmed = dfg.median()
dmax = dfg.max()
err = (np.abs(dfg.quantile([0.1, 0.9]) - dmed)).unstack()
ax = dmed.plot.bar(yerr=err.values.T, ylabel="Max altitude [masl]", xlabel="Year")
for i, p in enumerate(ax.patches):
    ax.plot(p.get_center()[0], dmax.iloc[i], marker="*", ls=None, c="C0")
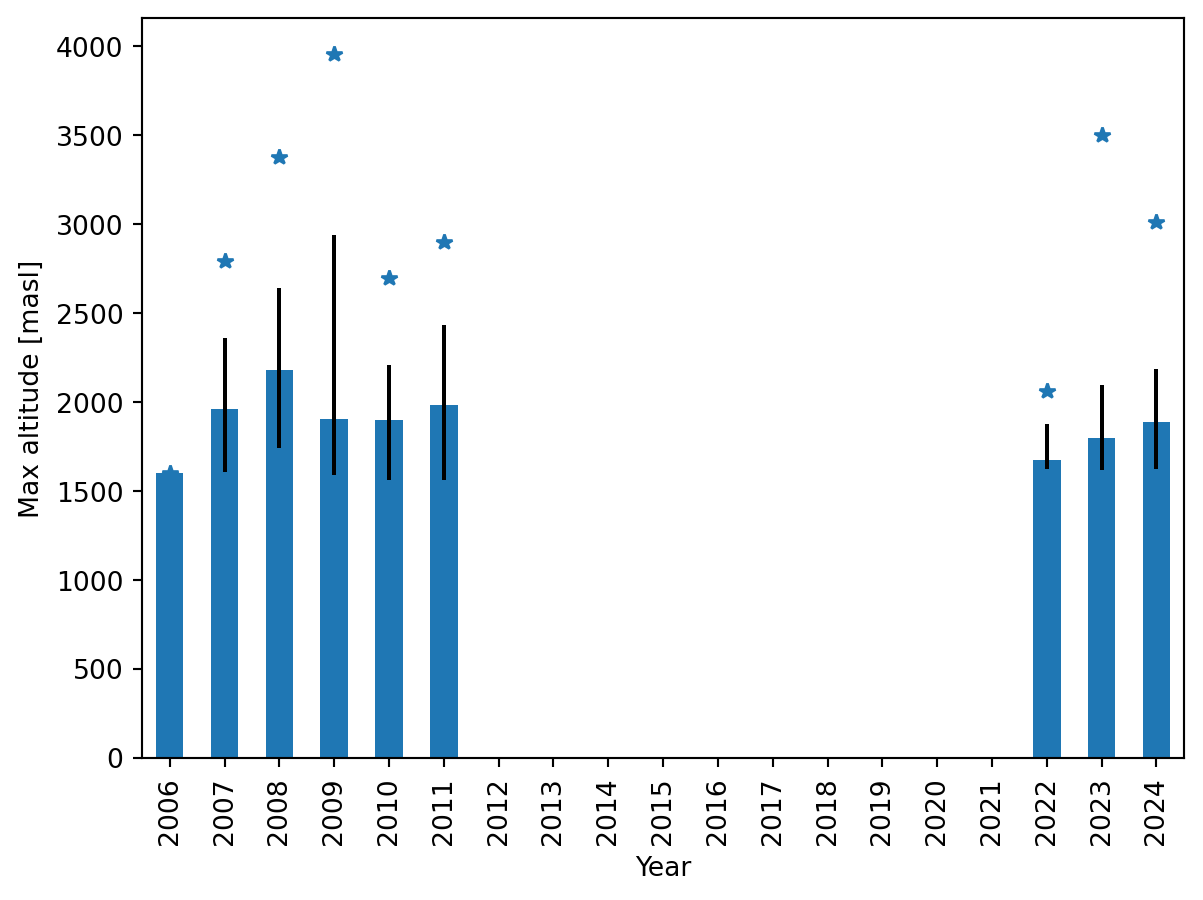
Figure 2: Maximum flight altitude per year
Code
dfg = df.groupby(df.datetime.dt.year).length_km
dmed = dfg.median()
dmax = dfg.max()
err = (np.abs(dfg.quantile([0.1, 0.9]) - dmed)).unstack()
ax = dmed.plot.bar(yerr=err.values.T, ylabel="Max distance [km]")
for i, p in enumerate(ax.patches):
    ax.plot(p.get_center()[0], dmax.iloc[i], marker="*", ls=None, c="C0")
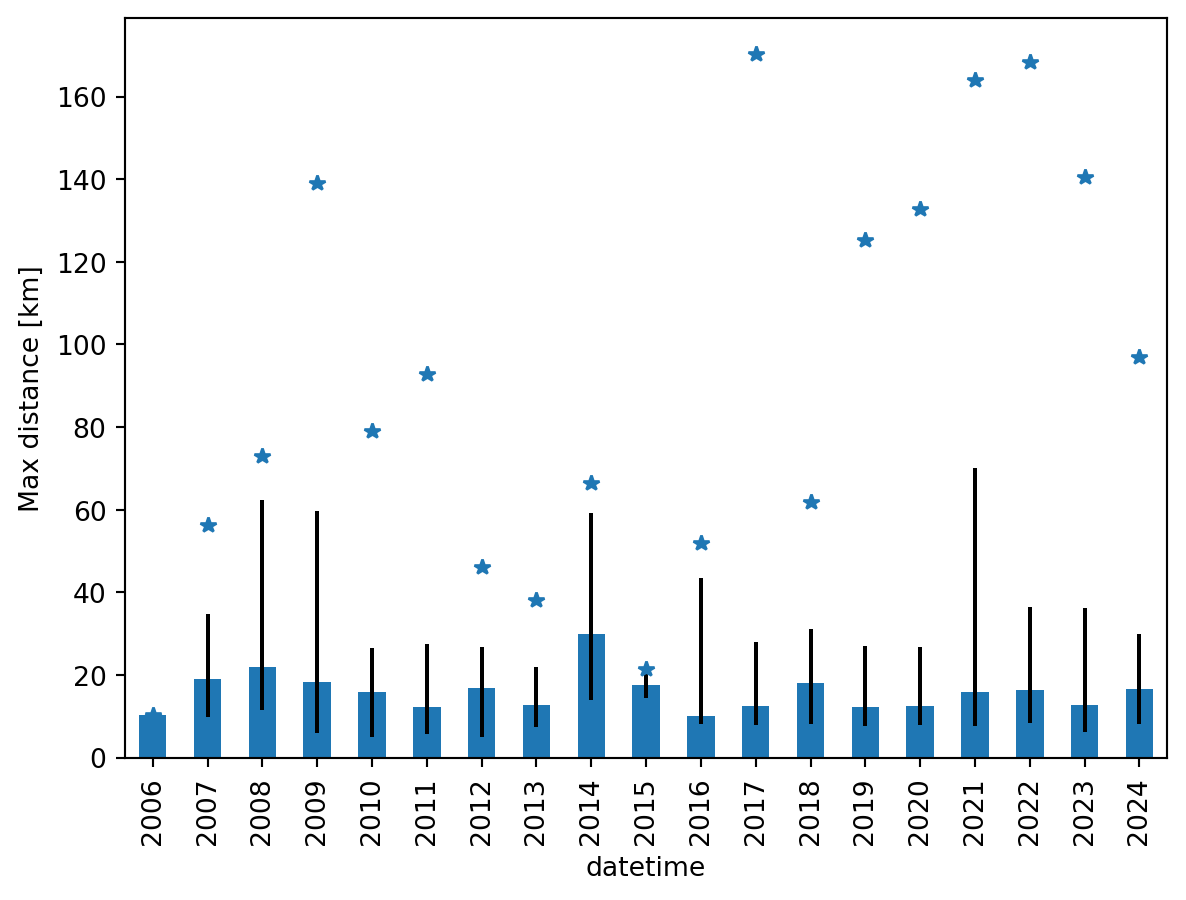
Figure 3: Maximum flight distance per year
Code
dfg = df.groupby(df.datetime.dt.year).airtime_hours
dmed = dfg.median()
dmax = dfg.max()
err = (np.abs(dfg.quantile([0.1, 0.9]) - dmed)).unstack()
ax = dmed.plot.bar(yerr=err.values.T, ylabel="Max airtime [h]")
for i, p in enumerate(ax.patches):
    ax.plot(p.get_center()[0], dmax.iloc[i], marker="*", ls=None, c="C0")
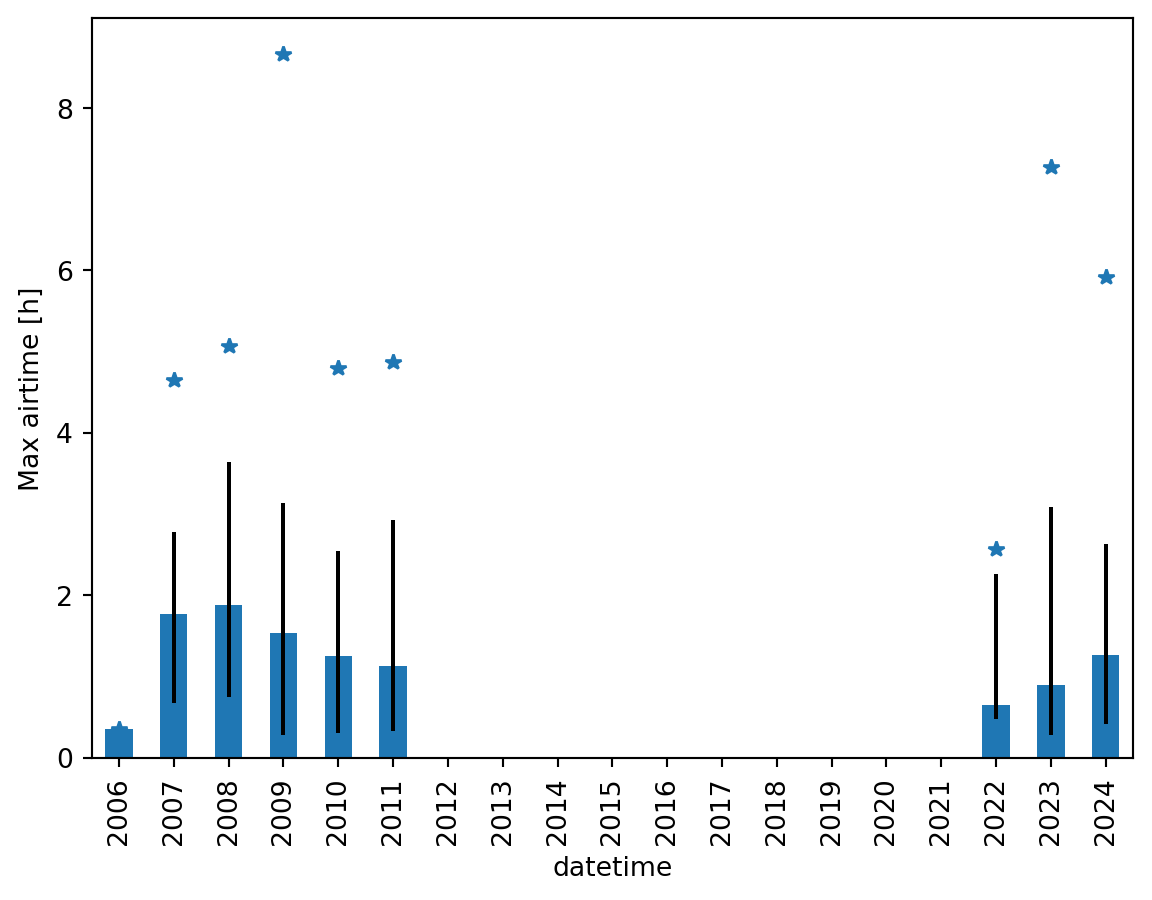
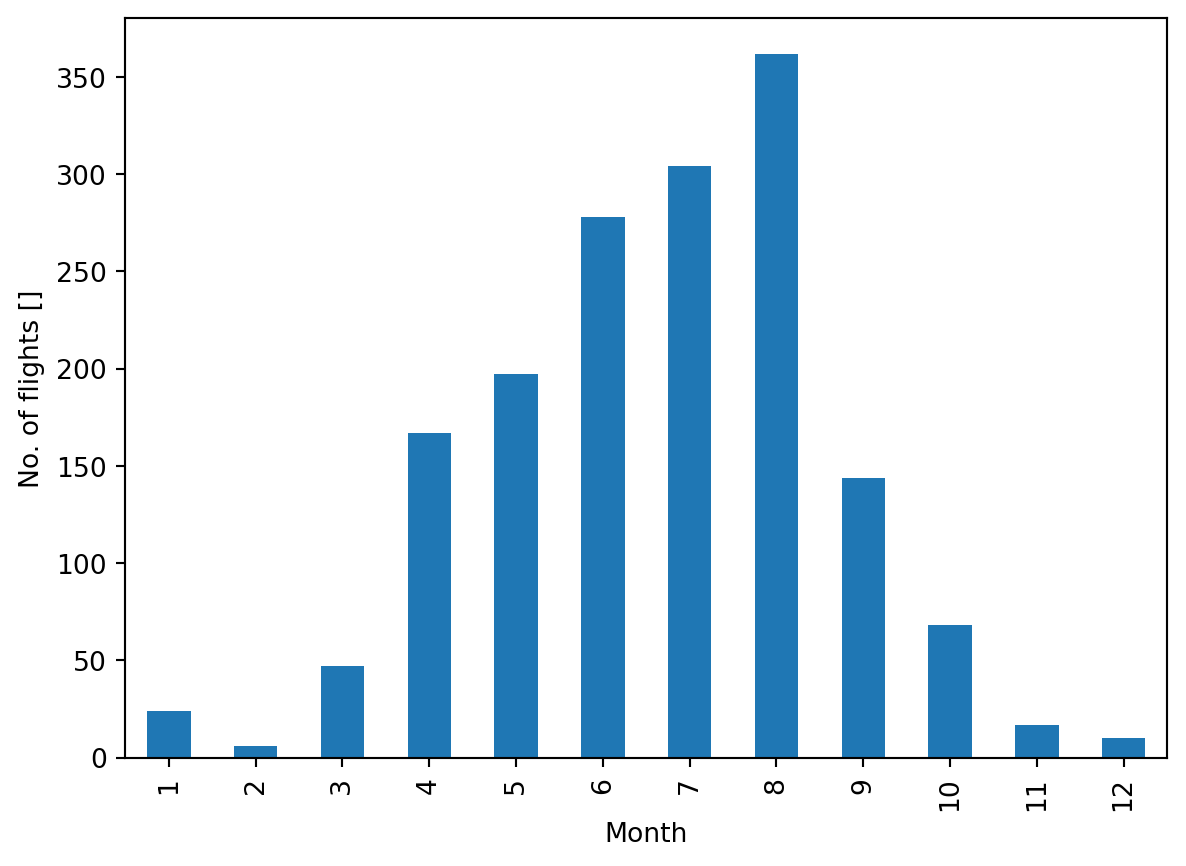
Figure 4: Maximum flight duration per year

Monthly statistics

Code
dfg = df.groupby(df.datetime.dt.month).datetime.count()
ax = dfg.plot(kind="bar", ylabel="No. of flights []", xlabel="Month")
Figure 5: Total number of flights per month
Code
months = pd.date_range("1900-01-01", "1900-12-01", freq='MS').strftime("%b")
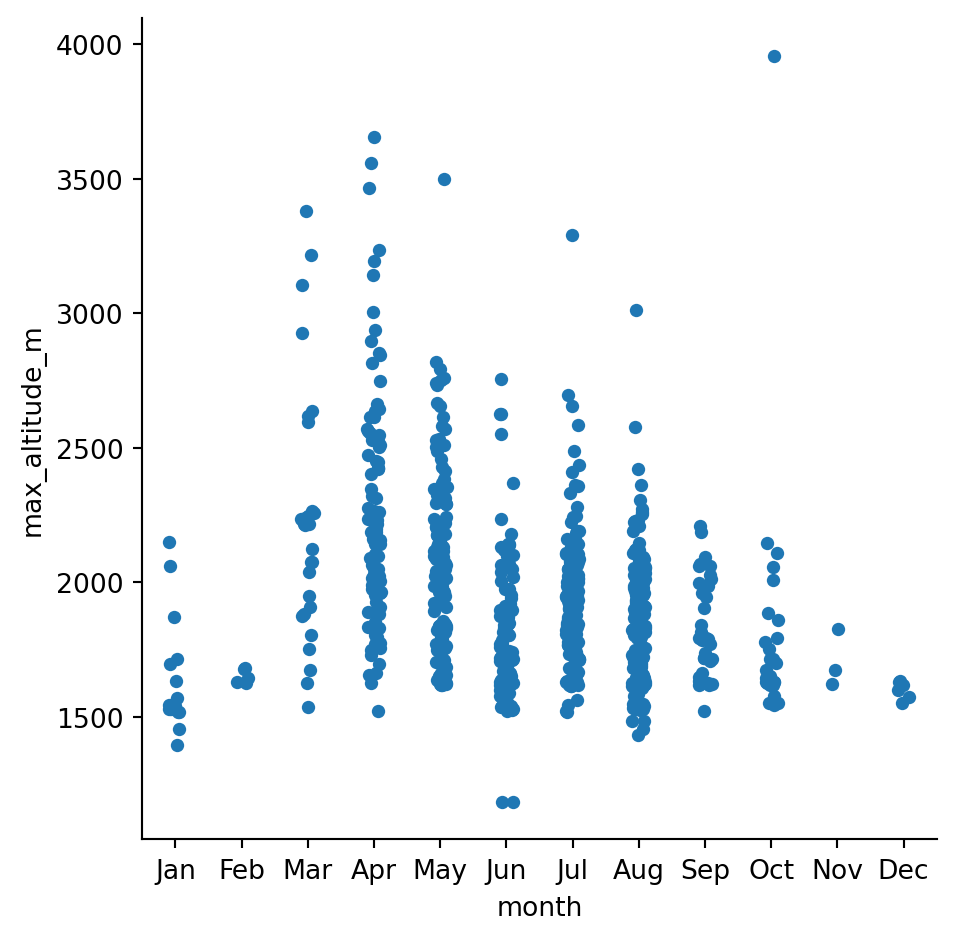
ax = sns.catplot(x="month", y="max_altitude_m", order=months, data=df)
Figure 6: Maximum flight altitude per month
Code
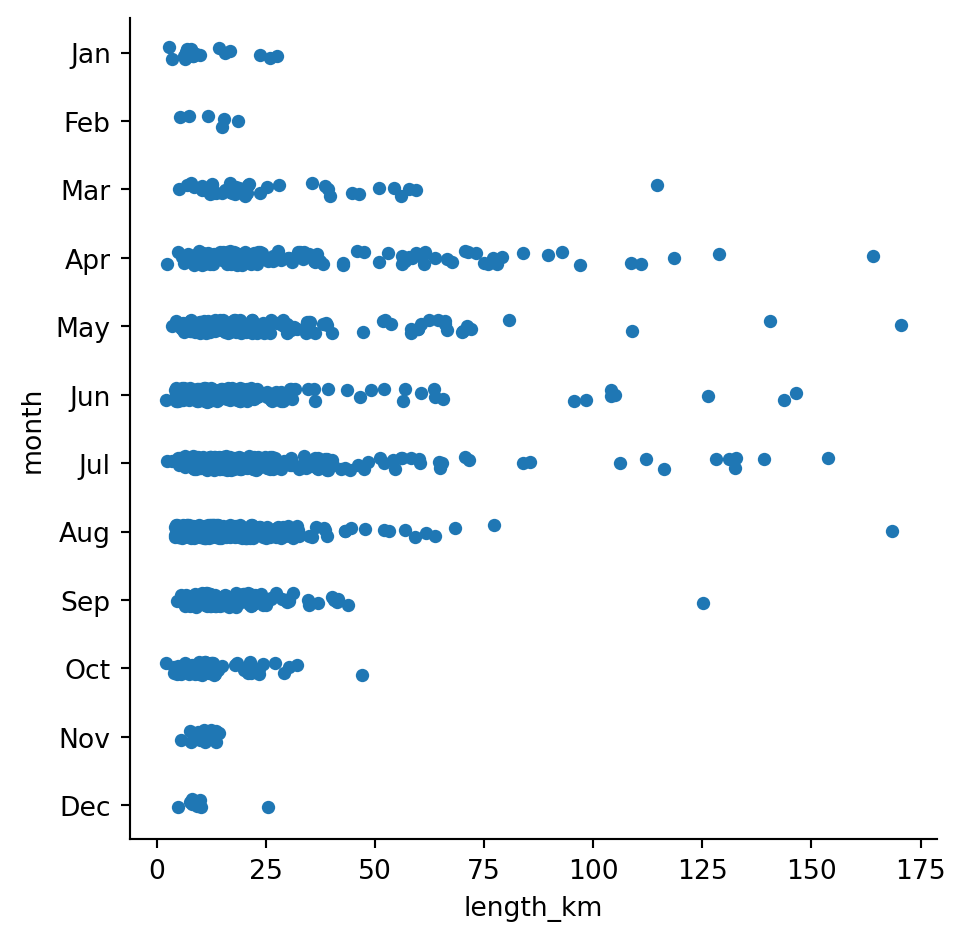
ax = sns.catplot(x="length_km", y="month", order=months, data=df)
Figure 7: Maximum flight distance per month
Code
ax = sns.catplot(x="airtime_hours", y="month", order=months, data=df)
Figure 8: Maximum flight duration per month