Code
TARGET_SITE_ID = 31500 masl
September 30, 2025
from datetime import date, datetime, timedelta, timezone

import matplotlib.pyplot as plt
import numpy as np
import pandas as pd
import seaborn as sns

from startleiter.utils import get_engine, get_flights, get_predictions

engine = get_engine()
df_flight = get_flights(engine, TARGET_SITE_ID)
df_pred = get_predictions(engine, TARGET_SITE_ID)| validtime | flying_probability | max_altitude_masl | max_distance_km | |
|---|---|---|---|---|
| 34745 | 2025-09-30 | 0.866769 | 1500.0 | 10.0 |
| 34752 | 2025-10-01 | 0.735387 | 1500.0 | 10.0 |
| 34759 | 2025-10-02 | 0.812280 | 2500.0 | 10.0 |
| 34766 | 2025-10-03 | 0.930108 | 3500.0 | 50.0 |
| 34773 | 2025-10-04 | 0.735340 | 1500.0 | 10.0 |
sns.set()

ts = df_flight.set_index("datetime").sort_index()
keep_cols = ["date", "max_altitude_m", "length_km", "airtime_hours"]
ts = ts[keep_cols]
empty_row = pd.Series(name=pd.Timestamp.today(tz="UTC"), data=[None,] * len(keep_cols), index=keep_cols)
ts = pd.concat([ts, empty_row.to_frame().transpose()])

# compute reference statistics
n_years = 6
clim = ts.resample("1D").mean(numeric_only=True)
clim = clim.groupby(clim.index.isocalendar().week)
clim = clim.rolling(window=f"{n_years * 365}D", center=False).mean().reset_index(0, drop=True)
clim = clim.sort_index().rolling("20D", center=True).mean()

clim_counts = ts.date.resample("1D").count()
clim_counts = clim_counts.where(clim_counts > 0)
clim_counts = clim_counts.groupby(clim_counts.index.isocalendar().week)
clim_counts = clim_counts.rolling(window=f"{n_years * 365}D", center=False).mean().reset_index(0, drop=True)
clim_counts = clim_counts.sort_index().rolling("20D", center=True).mean()

end = datetime.now(timezone.utc)
start = end - timedelta(days=90)
clim = clim[clim.index > start]
clim_counts = clim_counts[clim_counts.index > start]
dfs = df_flight[df_flight.datetime > start]
dfg = dfs.groupby(df_flight.date).datetime.count()

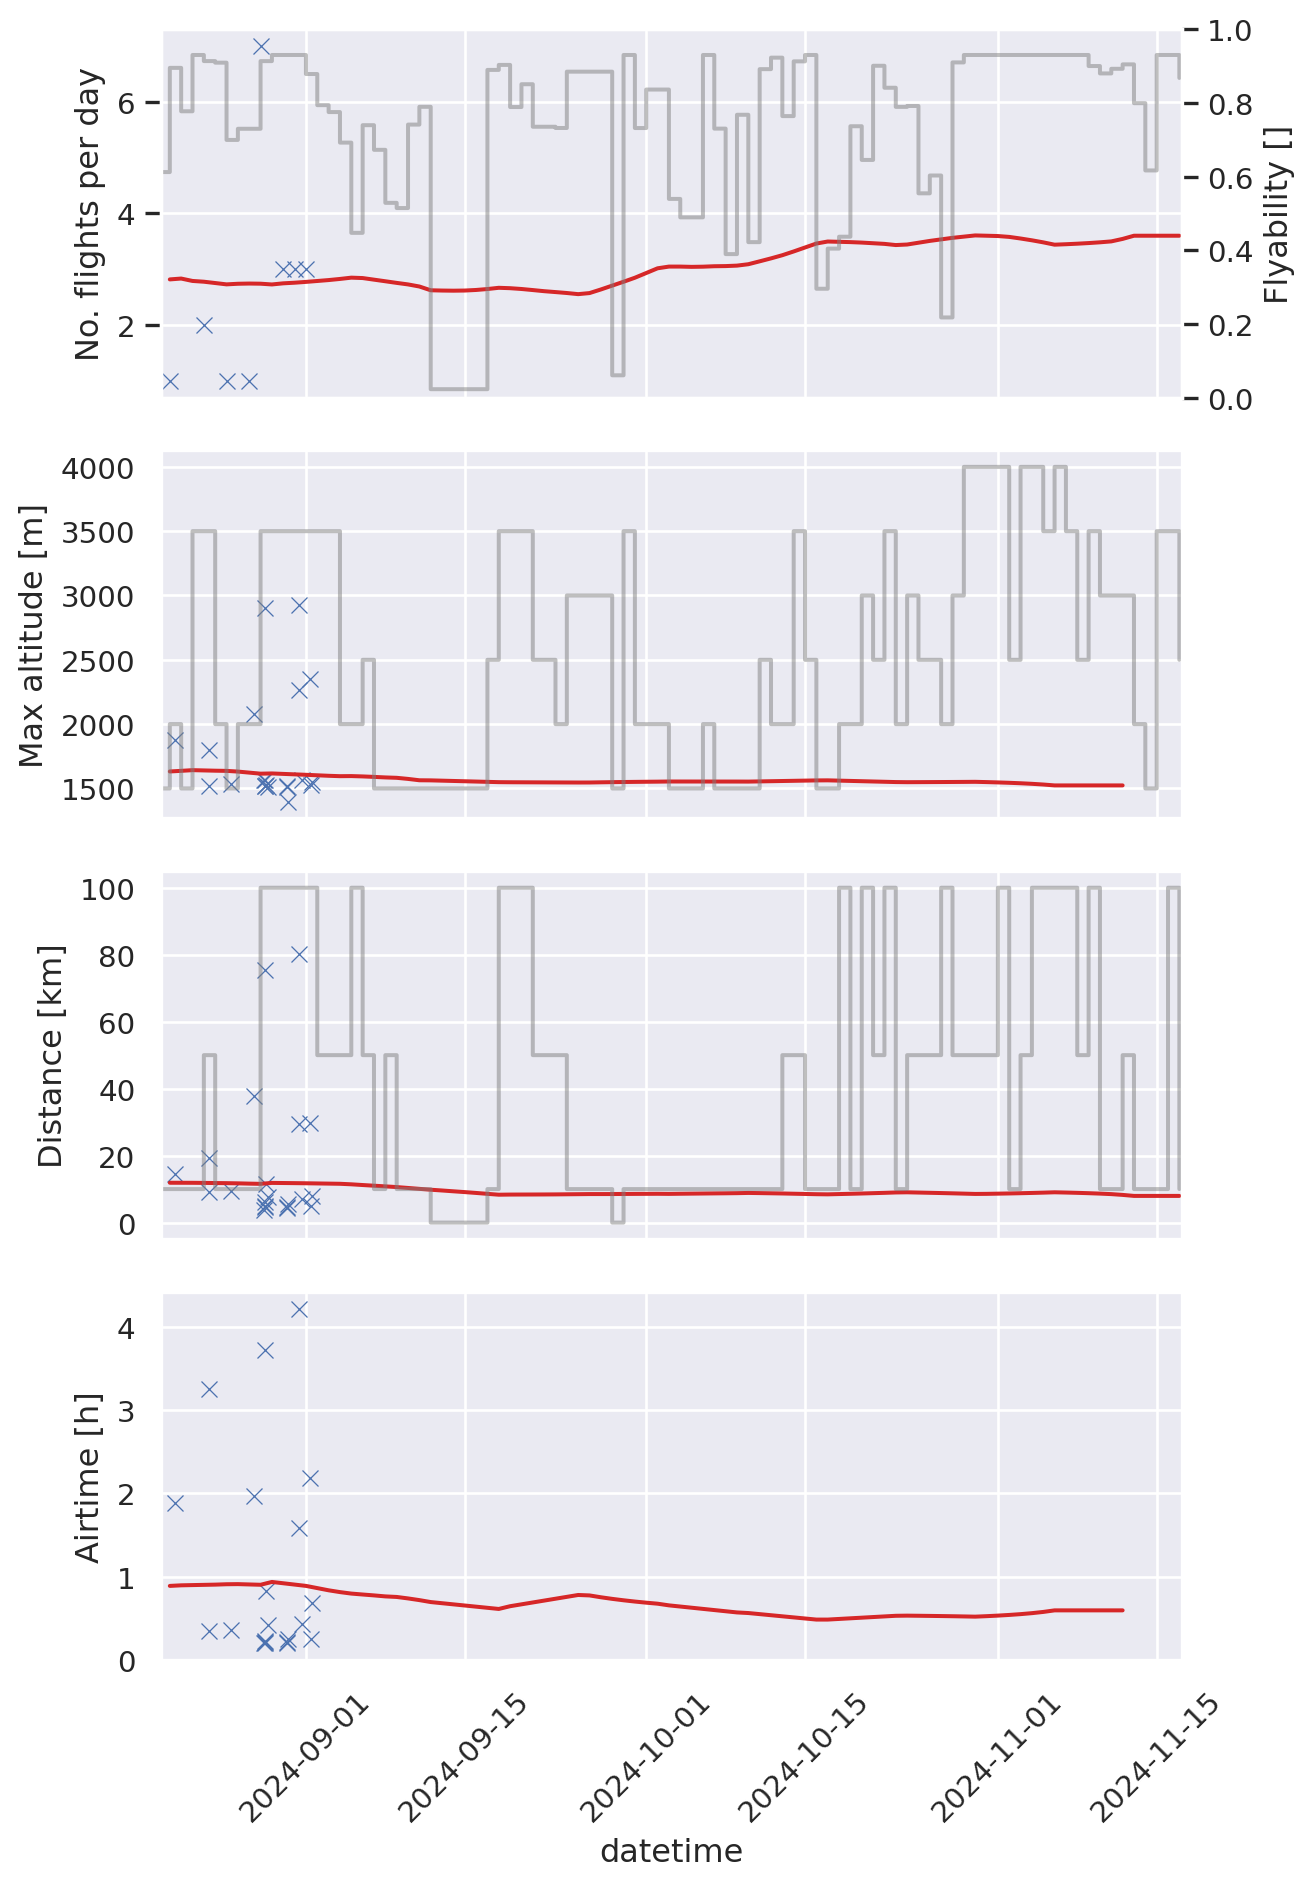
fig, axs = plt.subplots(4, sharex=True, figsize=(7, 10))

# reference lines
axs[0].plot(clim_counts.index, clim_counts.values, color="tab:red")
axs[1].plot(clim.index, clim.max_altitude_m, color="tab:red")
axs[2].plot(clim.index, clim.length_km, color="tab:red")
axs[3].plot(clim.index, clim.airtime_hours, color="tab:red")
axs[3].tick_params(axis="x", labelrotation=45)

# predictions
pred = df_pred[df_pred.leadtime_days==0].set_index("validtime").sort_index()
axs[0].twinx().step(pred.index, pred.flying_probability, where="post", color="gray", alpha=0.5)
twinx = plt.gca()
twinx.grid(None)
twinx.set_ylim([0, 1])
twinx.set_ylabel("Flyability []")
axs[1].step(pred.index, pred.max_altitude_masl, where="post", color="gray", alpha=0.5)
axs[2].step(pred.index, pred.max_distance_km, where="post", color="gray", alpha=0.5)

# plot individual flights
ax0 = sns.scatterplot(x=dfg.index, y=dfg.values, marker="x", ax=axs[0])
ax1 = sns.scatterplot(x="datetime", y="max_altitude_m", marker="x", data=dfs, ax=axs[1])
ax2 = sns.scatterplot(x="datetime", y="length_km", marker="x", data=dfs, ax=axs[2])
ax3 = sns.scatterplot(x="datetime", y="airtime_hours", marker="x", data=dfs, ax=axs[3])

ax0.set(ylabel="No. flights per day")
ax1.set(ylabel="Max altitude [m]")
ax2.set(ylabel="Distance [km]")
ax3.set(ylabel="Airtime [h]")

ax0.set_xlim([start, end])
ax1.set_xlim([start, end])
ax2.set_xlim([start, end])
ax3.set_xlim([start, end])

plt.tight_layout()